


The Sharpe-r Image: 60/40 and Portfolio Selection
Why the 60/40 Portfolio Allocation Doesn't Make Sense

Here's something I don't understand about the traditional "balanced" portfolio of 60% stocks and 40% bonds: Why is it 60/40? Why isn't it 40/60, or 80/20, or 100/0? Why don't we bring in leverage and make it 120/-20?
When John Bogle conceived of the 60-40 portfolio as a recommended default allocation for every investor, his logic was that stocks provided "growth" and bonds provided "stability". Younger investors could afford to change the portfolio (holding e.g. 80% stocks), and older investors could increase to an even split of stocks and bonds, but 60/40 has always been the classic — and default — portfolio.
Looking the data, I'm not quite sure why. To get our bearings, let's begin by considering the returns on stock and bond indices from 1988 to present:

As expected, stocks have much higher returns and a commensurate higher level of volatility. Since 1988, the S&P500 has returned nearly 11.1% annualized, including dividends, while the Bloomberg Aggregate bond index achieved a 6.5% annualized return. Balanced portfolios, like the 60/40 plotted in navy in Fig. 1, are going to be some convex combination of these two lines in both level (returns) and variance (volatility). Since investors like higher returns and dislike volatility, it is not prima facie obvious which portfolio is optimal.
Fortunately, financial economists have developed a parsimonious way of weighing the risk-return tradeoff, namely, the Sharpe ratio. The Sharpe ratio measures the average excess return per unit of risk (volatility). That is,
where E[R_p-R_f]$ is the expected return on a given portfolio p net of the risk-free rate R_f, and σ(R_p) is the standard deviation of the portfolio's returns. Higher Sharpe ratios are better in the sense that they imply higher returns per unit of risk.
This is where the data start to make less sense. To the extent advisors referred to 60/40 as a favorable balance, I had assumed they had meant it with respect to some metric like a Sharpe ratio. That is, perhaps 60/40 was the optimal tradeoff of risk and return that maximized compensation for a given level of volatility.
But this is not the case...and not even close. The figure below plots the Sharpe ratio across different stock-bond allocation weights. The blue line uses data from 1988 onwards (the Bloomberg Aggregate Total Return Index), while the red line uses a different bond index from 2003 onwards (the iShares Core US Aggregate Bond ETF). Despite the difference in time frame and index, both curves suggest the optimal balanced portfolio is something like 20/80!

In fact, a 60/40 portfolio delivers a sharpe ratio of roughly 0.24 compared to Sharpe ratios close to 0.30 for a portfolio tilted more heavily toward bonds. To see concretely the difference in these two allocations, consider what the portfolios look like in mean-variance space:
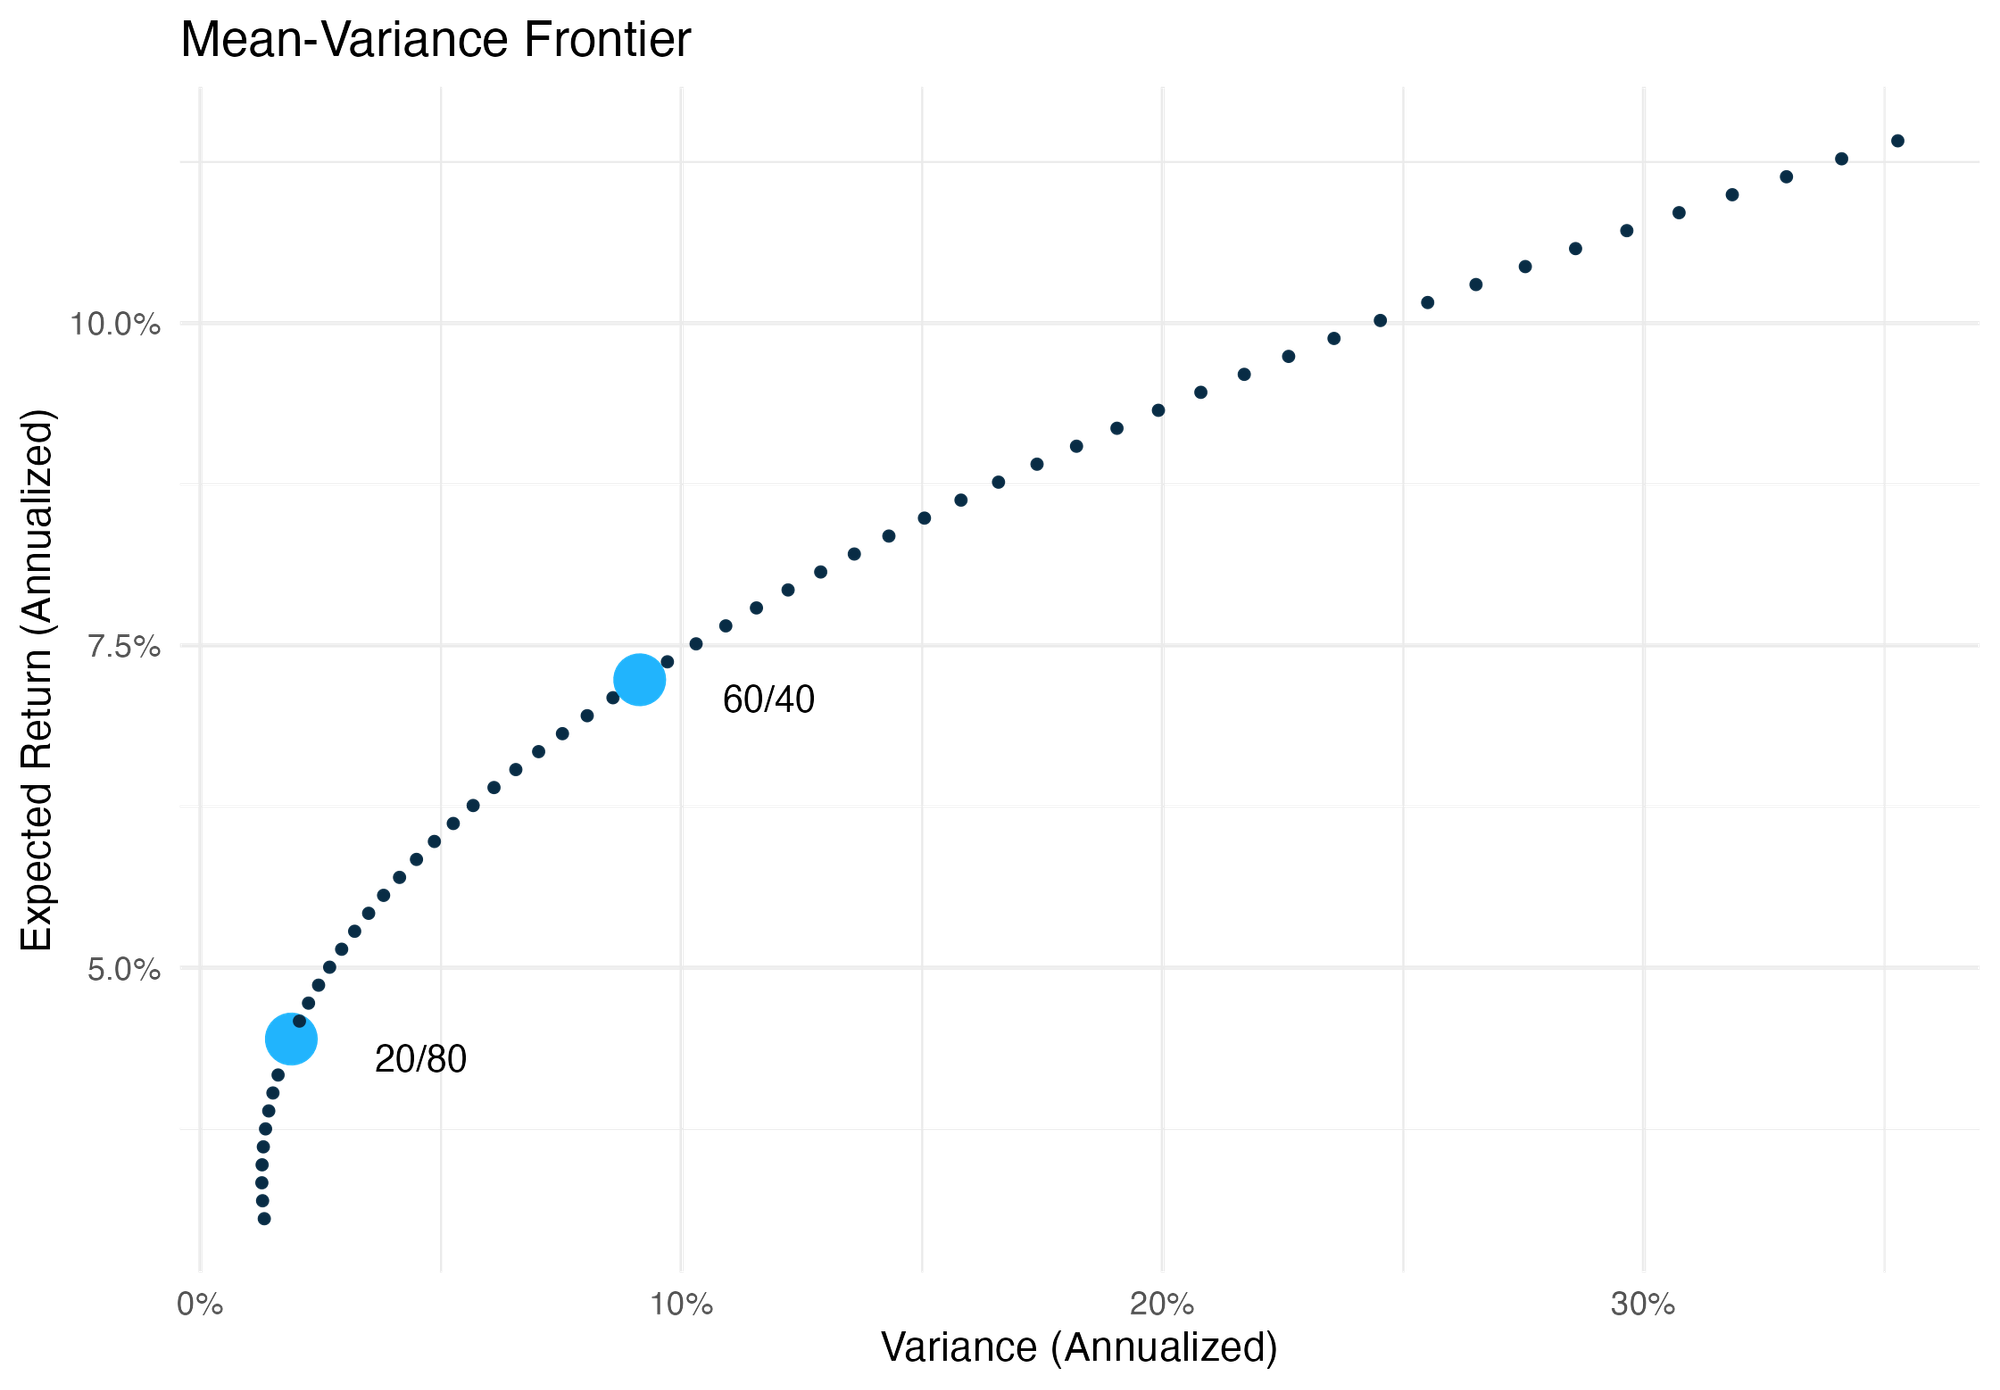
The Sharpe-optimal portfolio achieves annualized returns of 4.5% with 2% volatility. The classic 60/40 portfolio achieves 7.2% annualized returns with almost 9% annualized vol.
The sense in which these results interact with modern portfolio theory is complicated. Under a CAPM model of the world, the market portfolio (i.e. the stock index) is the maximum sharpe ratio portfolio among risky assets, and investors will hold the market portfolio and a risk free asset in weights determined by their individual risk preferences. Bond indices — such as the ones analyzed above — are composites of both risk-free assets (e.g. US Treasuries) as well as some risky assets (corporate bonds), but are probably closer to the former than the latter. If the bond index truly is risk free, then CAPM predicts every portfolio made up of the stock index and the bond index should have the same Sharpe ratio. (To see why, observe that the marginal dollar switched over to the risk-free asset has no effect on either the excess return or the variance of the portfolio). Since this is clearly not the case, either CAPM is wrong (almost certainly true), the Bond portfolio isn't a good proxy for the risk-free asset (evidently true), or something about the sample period we analyze is wrong (possible).
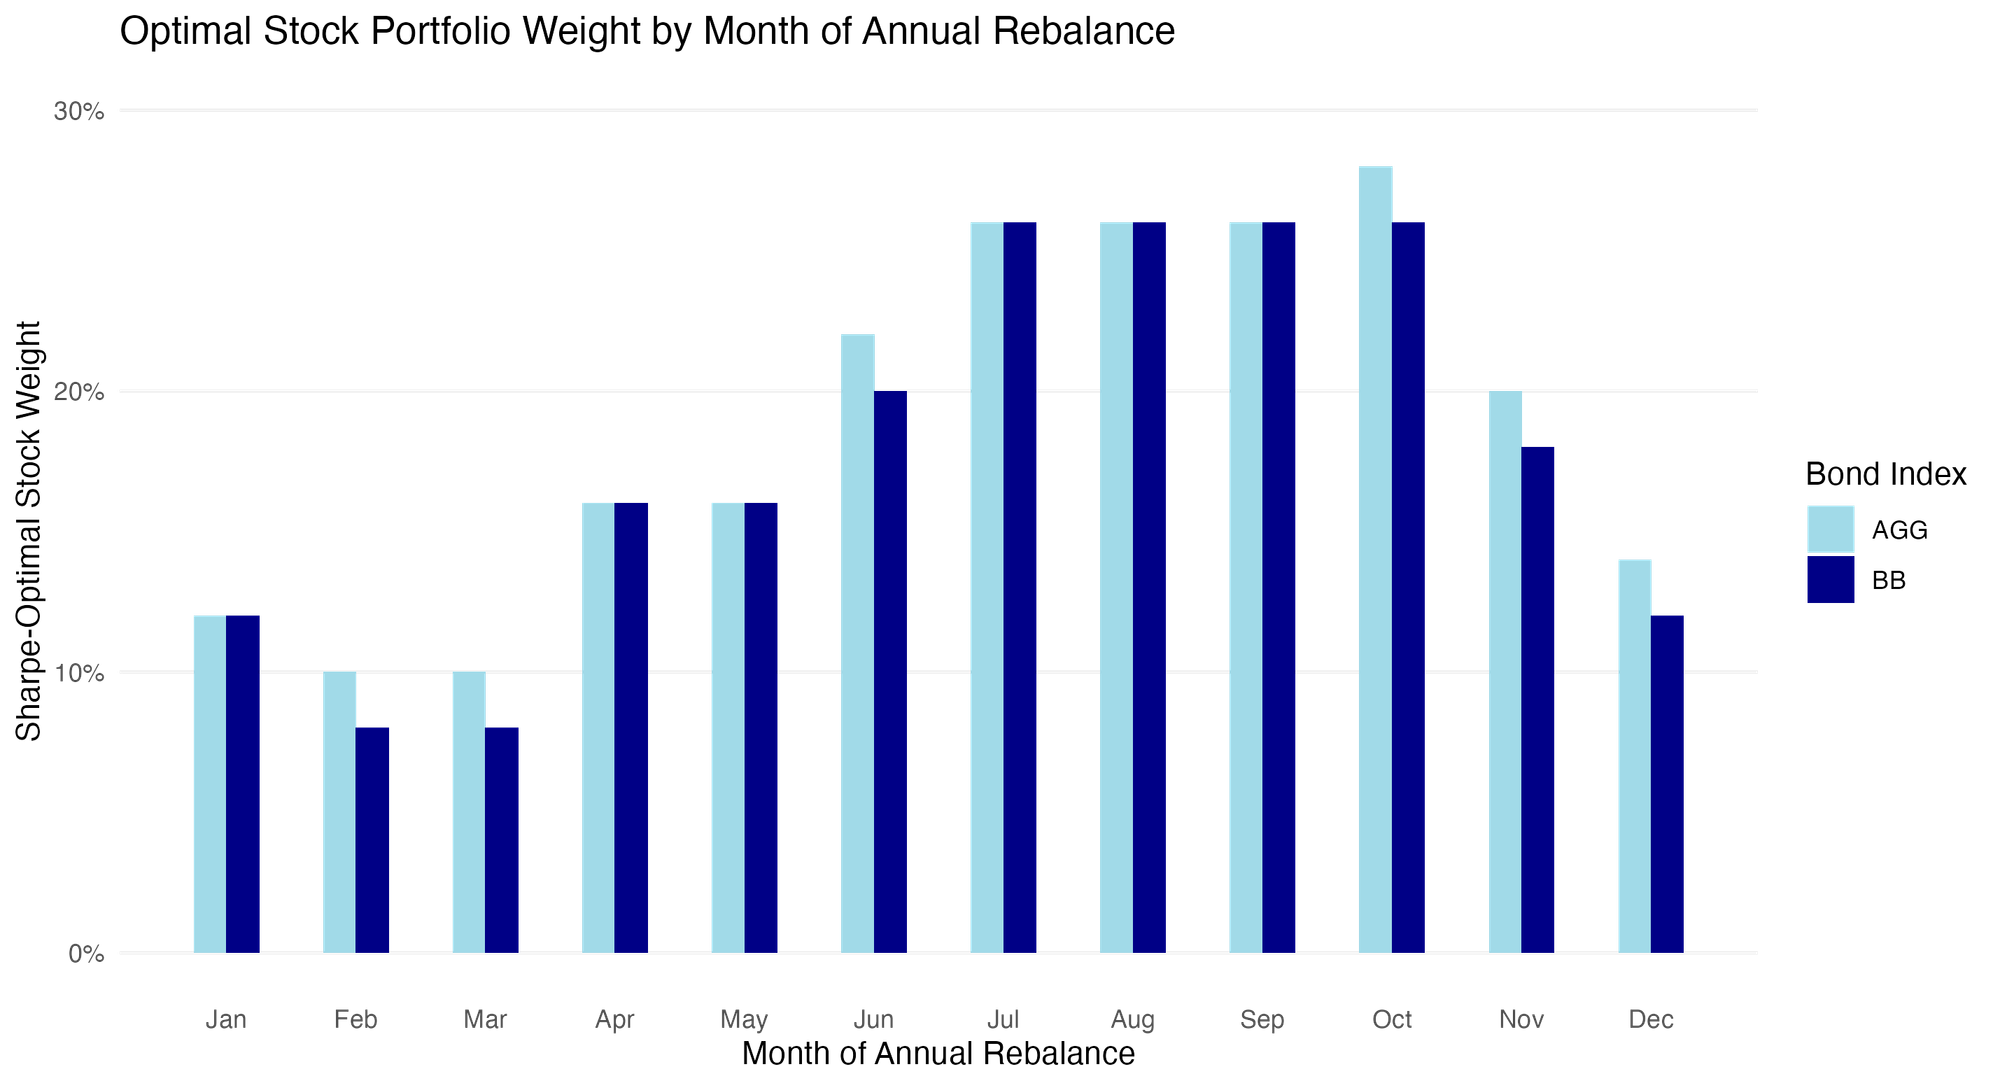
What about frequency? The values above are all calculated using monthly returns, which may give special results if assets display statistically significant autocorrelations. For robustness, I re-estimate the optimal Sharpe ratios above using annual returns (calculated in December of each year) and 1-year market yields on treasuries from FRED as the risk-free rate. Using this data, the optimal Sharpe ratio tilts even more in favor of bonds, with optimal stock weights between 12% and 16%. Finally, lest there is something special about end-of-year (December) rebalancing, I recalculate the Sharpe-optimal stock weight for each month (assuming that that month is when annual rebalancing takes place). No month yields an optimal stock-weight larger than 28%:
Leveraged Portfolios
Toward the beginning of the post, I mentioned the capacity for investing in leveraged portfolios. There are two ways to think about leverage in the context of the portfolio allocation problem. The first — when borrowing rates are similar to the bond yield index — is to allow an investor to take on negative weights in the safe asset, such that the amount invested in the market portfolio exceeds 100%. However, this type of leverage yields even lower Sharpe ratios as evident from the downward-sloping right tail of Fig 2.
The second way involves investing in leveraged stock and bond indices themselves. This corresponds to the case when borrowing can be done at a small cost much lower than the bond index yield (e.g. funded by 1-3 month treasuries, or reallocating from one's cash account). Investor Cliff Asness popularized the notion of a leveraged 60/40 portfolio that amounts to scaling the returns by a given factor (in his proposed case, 1.5). The resulting 90/60 portfolio has an identical Sharpe ratio (since Sharpe ratios are invariant to scaling), but moves the portfolio on the mean-variance frontier to a preferred level (typically one in which the expected return matches the average unleveraged all-equity return). The idea behind the "leveraged 60/40" is that it achieves equity-like returns with lower risk.
But once more, if the goal is to minimize risk subject to equity-like returns, why is the benchmark the 60/40 and not the Sharpe-est portfolio? Suppose we wanted to match the average unconditional equity risk premium over our sample at the monthly level (0.83%).
The market portfolio (e.g. 100% stocks) achieves this with 4.1% standard deviation.
A 1.38 leveraged 60/40 portfolio achieves this with 3.49% standard deviation.
A 2.25 leveraged 14/86 portfolio — i.e. the maximum Sharpe ratio portfolio — achieves this with just 2.58% standard deviation.
My point is not to encourage individuals to go searching for 2.25X leveraged products. Rather, it is to question the folk wisdom embedded in the construction of so-called "stable" portfolios like 60/40. If Sharpe ratios are all that matter, then maybe 14/86 is the new 60/40.